
How can design create a leverage point that enables accountability while driving economic growth in more sustainable practices?

Approach
Wicked Problem Mapping, stakeholder mapping, interviews and case studies.
Figure 1: mind maps, stakeholder maps, process maps and interviewer notes.
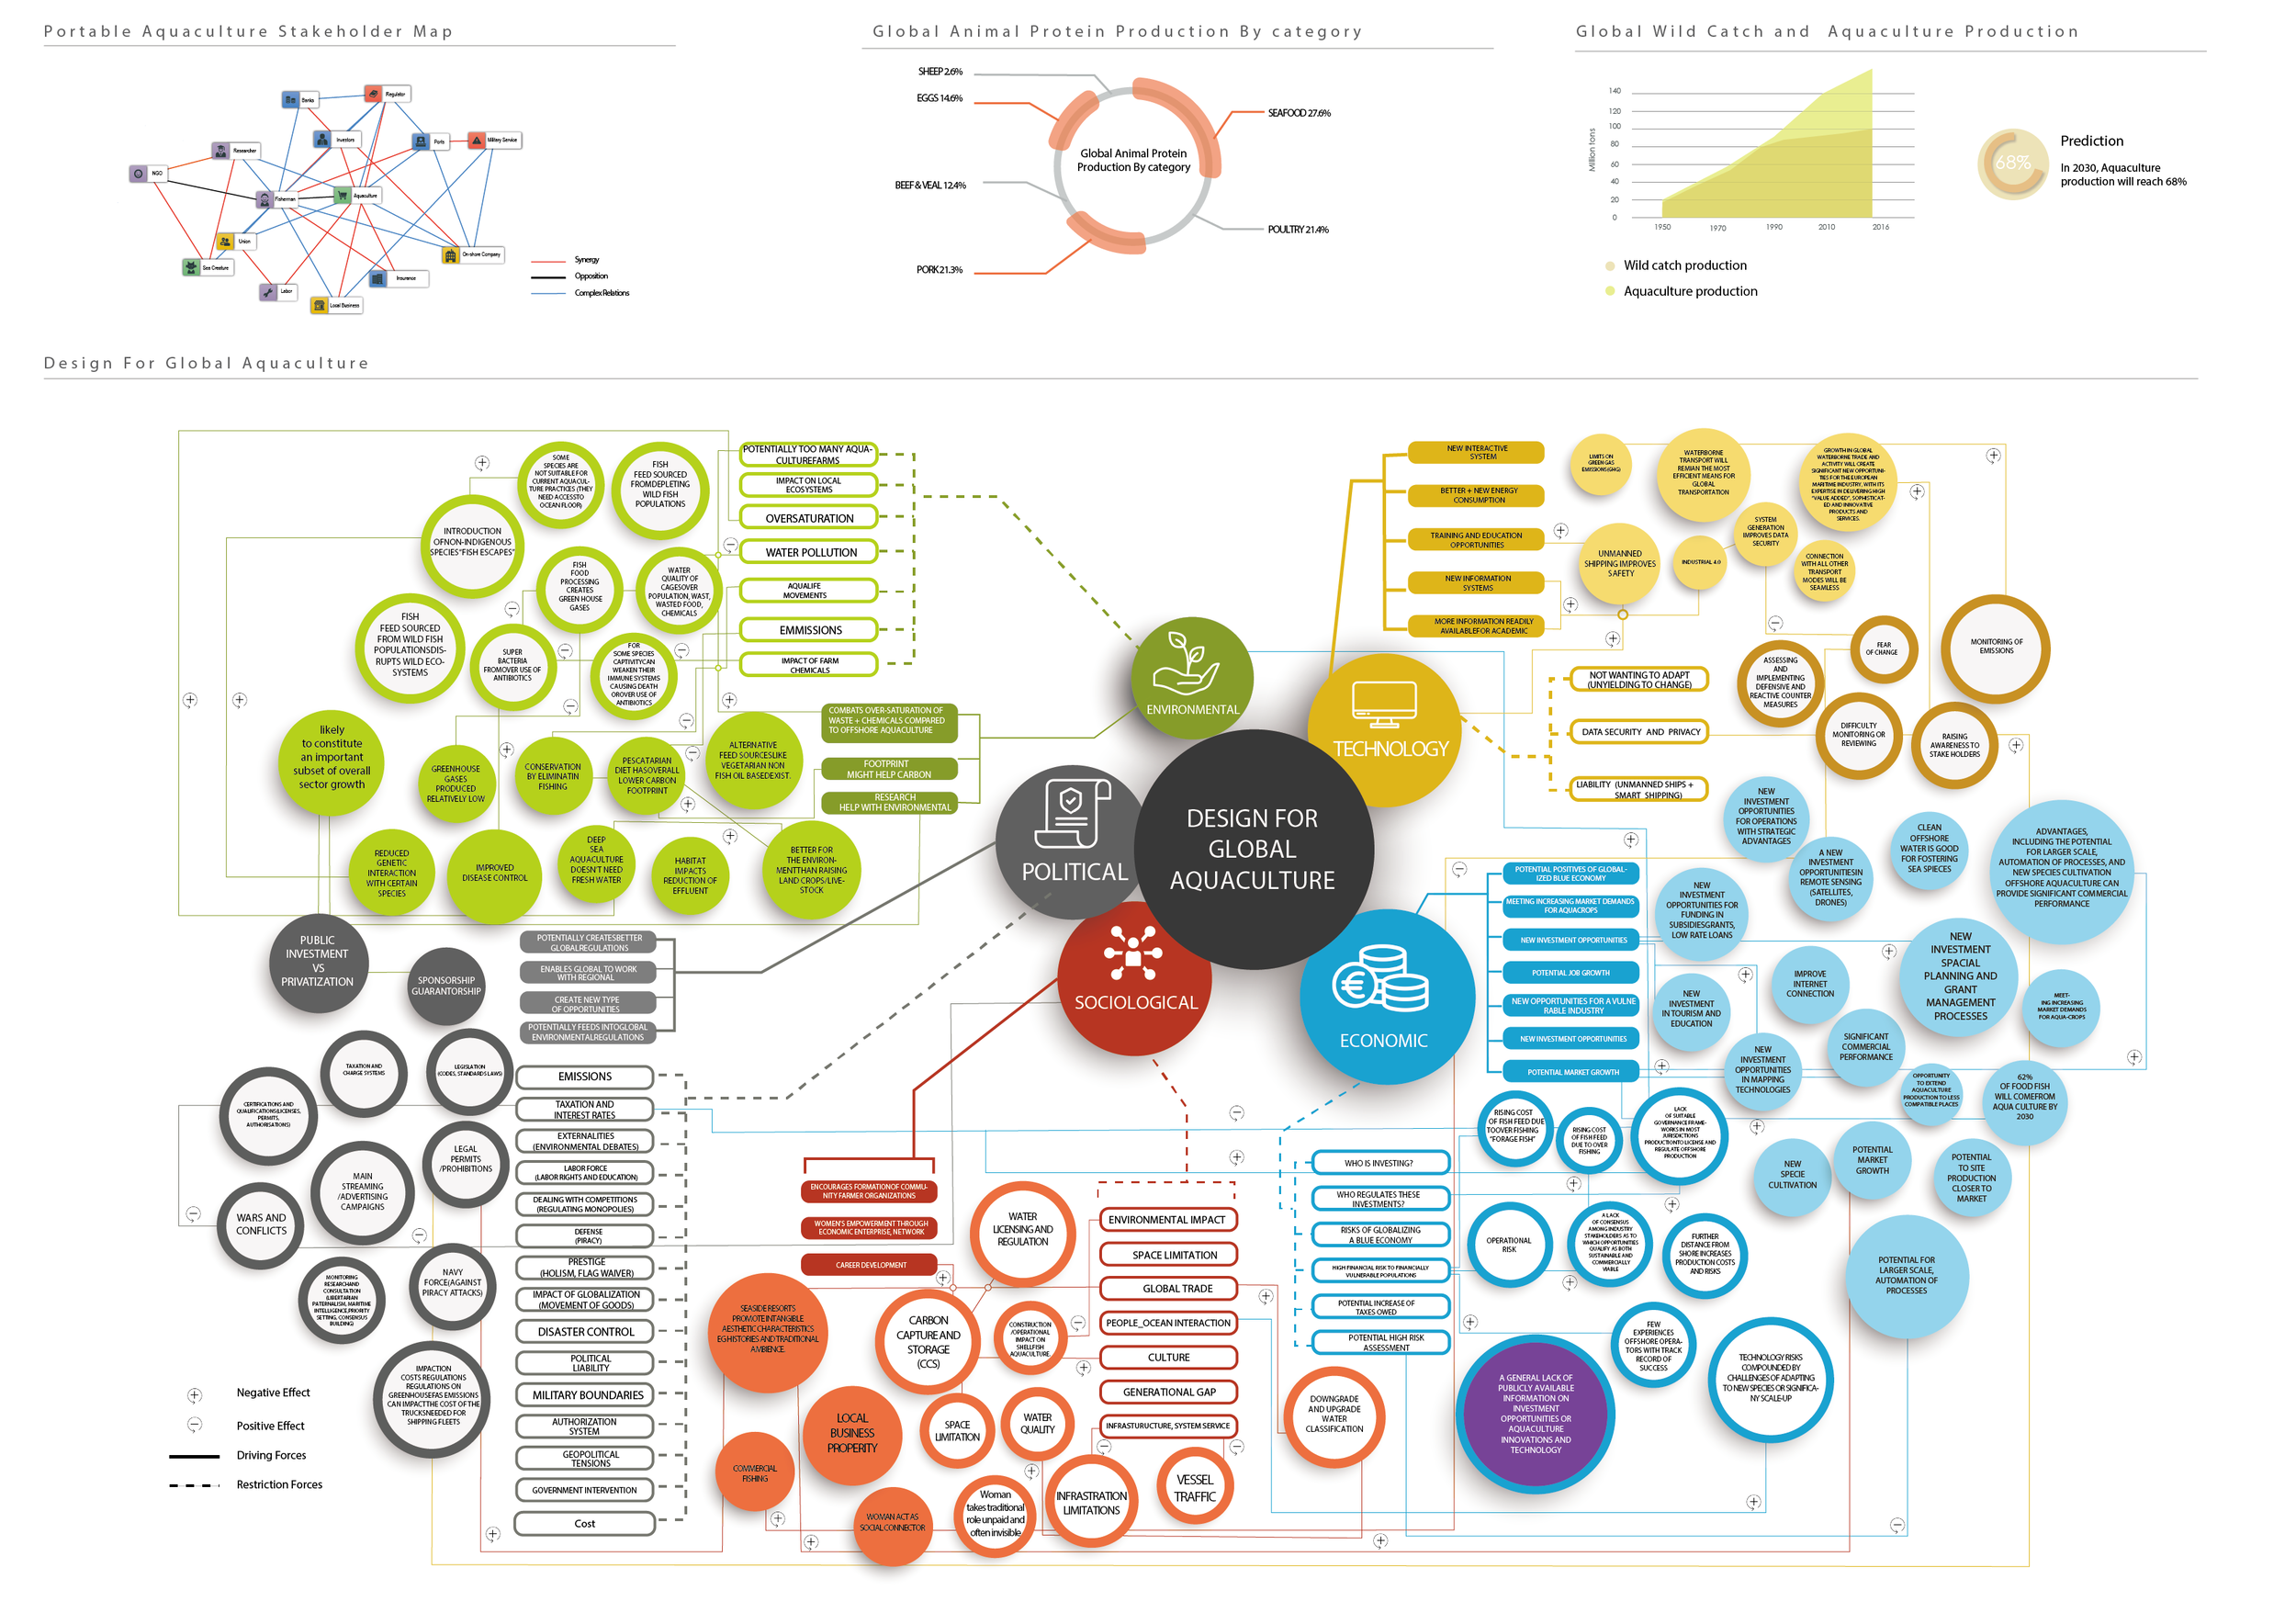
Figure 2: Aquaculture “Wicked Problem” map.

Methods
Design for Social Innovation
We proposed that by leveraging the theory of “design for social innovation” or design that focuses on environmental issues at the governance level using technological advances that also tackle the social aspects of global warming (Ceschin & Gaziulusoy, 2016), you can restructure economic grow back into independent and local fishing which could minimise the enormous carbon footprint of the fishing industry. By harnessing consumer buying power, we aimed to create immersive experiences would that would engage and educate the consumer while connecting them to local fish farmers and fish mongers.

Aim
Building relationships between salmon farmers and consumers through transparency, choice and immersive interaction.
Figure 4: Areas of focused impact.
“170 million tonnes of fish are being consumed annually, with 80 million tonnes of that total raised in aquafarms.”
Unfortunately, this system is dominated by large international corporations who control the whole supply chain. Norwegian based global sh farming organizations grew to power due to a market collapse in the 1990’s and subsequent bankruptcies of what had been a system of small farms, the Norwegian government deregulated allowing for corporations to buy out smaller farms. This created great influence over the remaining small farms, making it dicult for these small operations to survive. By 2011, to optimize routes and reduce cost these companies began to move up (and down) the supply-chain, acquiring hatchling operations, processing plants and transportation. Because of lower costs labor in Asia, processing has been farmed out thousands of miles from the seas where the salmon are raised.
“The average piece of salmon travels 5,000 food miles before it hits your plate.”

Figure 5: Map of financial and environmental journey of a fish raised in corporate aquaculture.
Fish are often ash frozen in one country, shipped in cargo ships or planes, processed, frozen again and transported back to its country of origin. At top speed (23 to 28 miles per hour) a container ship can consume 63,000 gallons of marine fuel creating a huge carbon footprint for that piece of salmon. A control of the whole supply chain has created a lack of transparency, coupled with the deregulation of the 1990’s has laid the groundwork for over populated farms, poorly managed waste from farms and overuse of antibiotics.

Double Impact
Because of the aquaculture industry’s “double impact” we believe that this is an especially volatile area to create growth and change.
Figure 6: Illustration of “Double Impact” of aquaculture on environment
Consumers are getting wise to the power that large, often unregulated food companies have. In a 2018 study by the Center for Food Integrity found that consumers trusted food companies and regulatory bodies least for ensuring healthy food, farmers landing at 3rd behind doctors and family, while holding food companies and regulatory bodies the most accountable. What has been created is a poorly regulated industry, with a growing negative impact on the environment and a lack of trust from consumers.

Figure 7: Governance Value Chain Map“Governance Value Chain by Gere and Lee”, (Gere & Lee, 2014); adapted to governance structure of the salmon aquaculture by USAID (USAID, 2020).

Figure 8: Map of financial and environmental journey of a fish raised in a decentralisedand independent aquaculture “Independent Fish Farm Journey” (Anzilotti, 2017).


Figure 10: Interface prototyping
Figure 9: Designed interface that hammers home the immersive objective of the project.